Pint 3 - testing
This post covers my testing strategy and some implementation details for Pint - a reimplementation of the Windows 10 version of mspaint. I’ve already yapped about it a tiny bit in an earlier post and we’re going to expand on that. If that kind of topic isn’t your thing, feel free to skip ahead.
Strategy
The bottom line is I want a set of tests that can execute rather quickly (a couple seconds at most) and check for actual potential problems, not imaginary scenarios. I know it sounds like just about everyone’s plan for testing, but it’s easier said than done. I worked in projects with testing strategy so rigid, dogmatic, not to say zealous, that engineers were spending over 75% of their time writing and debugging the tests1. Most of these tests were verifying scenarios that never happened anyway. Code structure was weird because of it. Refactoring was a nightmare. On a few occasions I refused the urge to improve some tiny thing in the project due to the fear of having to write tests for half a day. Not great.
My goal is to avoid this situation at all costs. The tests should validate the application behavior using realistic, non-trivial inputs. If some situation in code seems highly improbable and theoretical, I’d rather throw in a debug assert that will catch it, instead of spending the afternoon engineering test scenarios for it. Chances are, it will never happen. Don’t get me wrong, corner cases and weird inputs do happen, but it should be assessed on a case by case basis whether they truly can realistically occur without cosmic rays’ involvement.
At the same time I’m a big believer when it comes to regression testing. If it happened once, it can surely happen twice. Any bug I spot, I secure with a test, so it will never happen again. The fact that the bug was spotted is the ultimate proof that it is possible and it is worth testing.
Testing scope
Integration
As I’ve already mentioned in the other post, most of the tests are integration level. What I mean by that is that they work with real Vulkan API, real GPU and on real data. Vulkan validation layer is programmatically enabled so that any improper usage of the API is caught2. Test images are small to make it faster, but not trivially small. I usually test with a 192x192 canvas, because it’s 3x3 tiles (remember tiles are 64x64?)
Most TDD/Clean Code enthusiasts would advise you to mock any external APIs and properly unit test any code interacting with them. That creates a giant friction, though. Any time you want to use a new API call, you have to mock it, process and validate arguments, store them somewhere and make some assertions. As time goes on, your mocks are getting more and more complex. Graphics APIs are not stateless. They require you to do things in a specific order, so you have to store a lot of state in your mocks and verify them each time an API call comes. You may find bugs in your mocks, hiding real bugs. At some point you start to feel like you’re implementing a graphics driver of your own3. Most importantly, you’re not even testing if your application works. You’re testing if it behaves in compliance with your mocks. Wouldn’t it be easier to just call the damn thing on a real GPU and observe the results? Verify the rendered result, check if validation layer didn’t report any errors, done.
Back to the topic, the main thing tested with the integration tests is the EditorEngine. As you may remember, it’s a central class implementing most of the drawing logic. I work hard to keep as much logic as possible behind this class’ interface, because it’s really easy to test. Its inputs are just a bunch of state setters and mouse movements and its output is a Vulkan image. Checking the contents of the output image for various inputs verifies correctness for all the input handling, the GPU shaders and the state tracking logic.
I also have a plan to test the Gui class. I specifically designed it to be decoupled from any windowing code, so that I can run the tests on offscreen images; without creating a real OS window. No Gui tests are implemented as of today, though, because I haven’t yet decided on what exactly they’re supposed to be testing. Also, not a lot of problems occur in the Gui class, so it’s fine for me to leave it untested in this early stage of development. It’s definitely something on my todo list, though.
Unit
Pint does have some tests you could call unit tests. They are small, self-contained and test just one tiny unit, be it a function or a class. Examples include math helpers, geometry structs (positions, rects, etc.), custom stack allocator or an ico file loader.
I don’t make any technical distinction for the unit tests.
They’re not pushed to a separate binary or hidden behind some CLI arg.
They’re tests like any other.
E2E
End to end testing would mean spawning an instance of the actual Pint application and interacting with it as a user would. That would involve some platform-specific tools for simulating mouse movements, keyboard strokes and capturing the output in the window. It’s the ultimate form of testing, although very costly, both in development and in runtime speed. While I value its benefits, end to end testing is out of scope in this stage of Pint development.
Testing framework
The choice of the testing framework is not terribly important, since all of the test code, fixtures and verification will have to be custom written for Pint anyway. It’s nice to have a framework that doesn’t get in the way, has concise syntax, minimal overhead and allows some test filtering via CLI. For me that’s googletest, a.k.a. Gtest. It’s a de facto standard in the C++ world. I learned it on my first job and never felt the need to try anything else4. It’s pretty heavy on macros, but then which C++ testing framework is not?
Gtest comes with GMock, which is a library for easy mocking of existing classes with virtual functions. I have to admit it’s pretty neat and convenient when you really want to mock. But I’m not making any use of it, since it gets too tempting to write too many mocked tests with no real value. And as already stated, majority of my tests are integration tests running the real thing, so mocking is not needed for the most part.
Tests implementation
My integration tests have to validate real data rendered by a GPU.
The VkImage object returned by EditorEngine cannot be directly read, because it’s not CPU accessible5.
We need a readback image - a one with exactly the same parameters, except that it can be mapped into CPU address range and verified.
Each test will create an instance of ReadbackImage.
It’s a simple class encapsulating an image and exposing its CPU address along with the memory layout (row pitch, offset from the start and size).
The tests perform a GPU copy operation from the image returned by EditorEngine into ReadbackImage.
struct ReadbackImage {
    PintResult init(PintExtent2D size);
    void destroy();
    VkSubresourceLayout getLayout() const;
    void *getCpuPtr() const;
}
The test images contain thousands of pixels, so it’s not practical to check them one by one.
A helper for making expectations about the data within ReadbackImage is also needed.
The ExpectedImage class wraps a CPU-only memory allocation (no VkImage involved) and offers simple methods to draw shapes into it.
The verify() method compares the expected data to the actual data read back from EditorEngine with a series of memcmp operations.
This allows for a simple to understand test code that verifies an entire rendered image at the same time.
struct ExpectedImage {
    PintResult init(PintExtent2D size);

    ExpectedImage& clear(PintColor color);
    ExpectedImage& drawAxisAlignedLine(PintPos2D a, PintPos2D b, PintColor color);
    ExpectedImage& drawAxisAlignedRect(PintPos2D a, PintPos2D b, PintColor color);
    void verify(const ReadbackImage &image);
};
When writing a set of non-trivial tests sharing some behavior, it’s good to define a fixture in Gtest.
A fixture is just a class containing common test logic and state, serving as a basis for the test.
Integration tests typically instantiate a Vulkan context, then EditorEngine, send some inputs to it, call render() and inspect the output image.
Below is a rough sketch of a test fixture implementing that. I skipped exact code for the image readback and some error handling for conciseness sake.
struct EditorEngineTests : ::testing::Test {
    std::unique_ptr<VulkanContext> ctx{};

    void SetUp() override {
        ctx = std::make_unique<VulkanContext>();
        ASSERT_PINT_SUCCESS(ctx->init());
    }

    void TearDown() override {
        ctx->destroy();
        ctx.reset();
    }

    PintResult render(EditorEngine &engine, ReadbackImage &readbackImage) const {
        PintResult result{};

        // Render a frame with editor engine
        VkImage outputImage = nullptr;
        VkSemaphore semaphore = nullptr;
        engine.render(&outputImage, &semaphore);

        // Copy editor engine output to the readback image
        vkAllocateCommandBuffers(...);
        vkBeginCommandBuffer(...);
        vkCmdPipelineBarrier(...); // prepare for copy
        vkCmdCopyImage(...);
        vkCmdPipelineBarrier(...); // prepare for host readback
        vkEndCommandBuffer(...);
        vkQueueSubmit(...);
        vkQueueWaitIdle(...);
        vkFreeCommandBuffers(...);

        return result;
    }
}
The render() method in our fixture simply calls EditorEngine::render(), but also performs the copy from its output image into a ReadbackImage that is used by the test.
It’s a rather verbose operation that would better not be duplicated in all tests.
With these auxiliary classes, the test code can look as simple and declarative as this. A real test checks a lot more cases, intermediate states and so on, but I hope you get the idea.
TEST_F(EditorEngineTests, SimpleRectDraw) {
    EditorEngine engine{*ctx};
    ReadbackImage readbackImage{};
    ExpectedImage expectedImage{};

    const PintExtent2D canvasSize = {114, 114};
    ASSERT_PINT_SUCCESS(engine.init(canvasSize));
    ASSERT_PINT_SUCCESS(readbackImage.init(canvasSize));
    ASSERT_PINT_SUCCESS(expectedImage.init(canvasSize));

    const PintColor colorRed {1,0,0,1};
    engine.setTool(PintTool::Rect);
    engine.setPrimaryColor(colorRed);
    engine.dragBegin(PintMouseButton::Left, {20, 20});
    engine.dragEnd({40, 40});

    ASSERT_PINT_SUCCESS(render(engine, readbackImage));
    expectedImage
        .clear(colorWhite)
        .drawAxisAlignedRect({20, 20}, {40, 40}, colorRed)
        .verify(readbackImage);
}
One improvement I quickly realized was necessary is sharing the VulkanContext object.
This is an object containing all the core long-lived vulkan objects, such as VkInstance or VkDevice.
Constructing it means initializing the majority of graphics driver state, which can take a lot of time.
I ended up implementing “fast mode” which creates only one instance of this object globally and sharing it for each test.
This has an unfortunate consequence of delaying any memory leak validation until all the tests are done, not after every test.
This problem is not that frequent, though, and also easy to fix, so I’m willing to bite the bullet here and get much faster tests.
An accidental benefit of this whole setup, along with clear documentation of all the helper classes and APIs, is that LLMs can do wonders implementing new tests. I find that language models can often get carried away and write way too complicated, hard to understand tests Although, this framework gives them a way to write tests more declaratively, which is what they do best.
Tooling
Supporting RenderDoc properly made debugging both the application and the tests significantly easier.
Renderdoc has its own private API for manually starting and ending frame captures.
It’s especially useful for tests, where we can call the API in SetUp()/TearDown() of our fixture to have a single capture for each test executed.
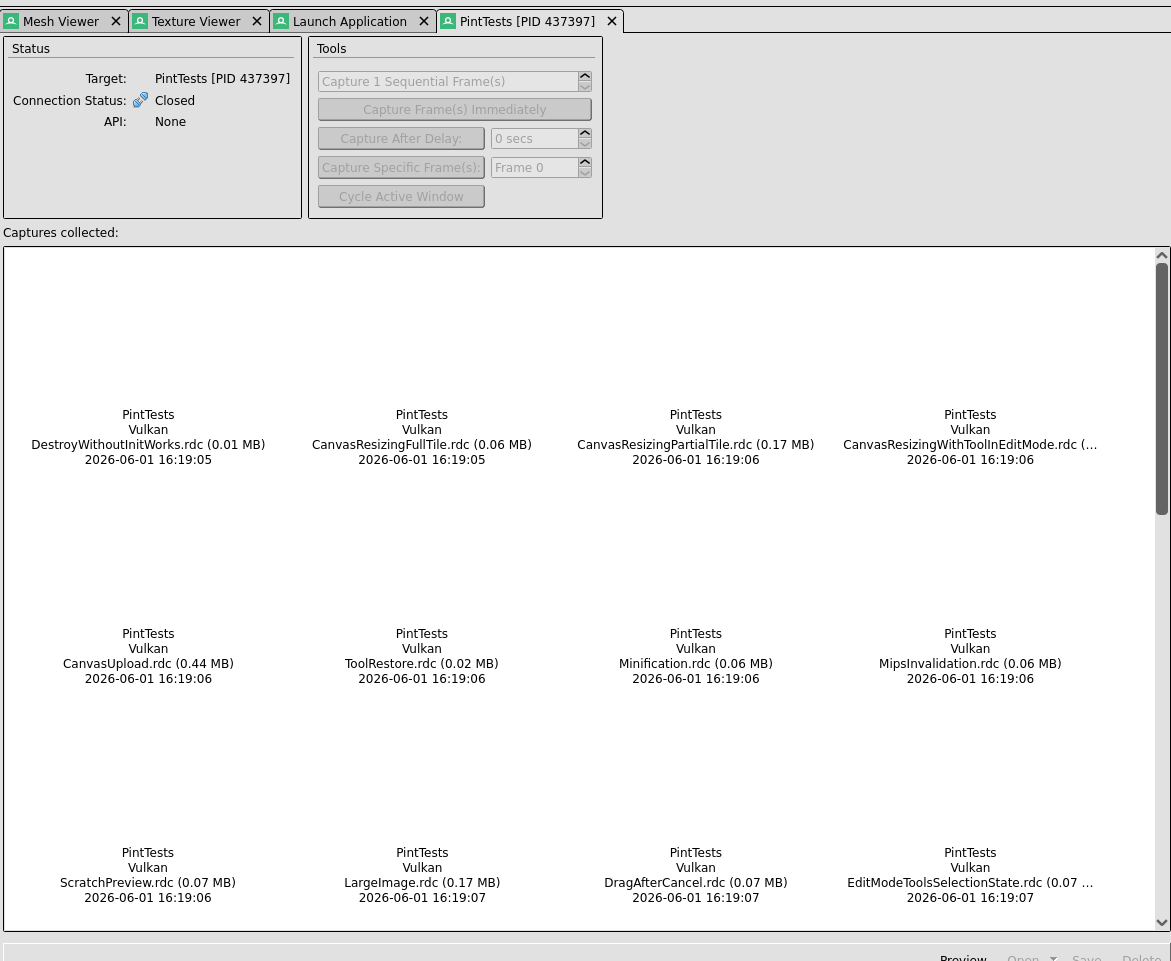
Here’s a list of captures from a full test run.
All of the entries are clickable allowing me to inspect the graphics state of what happened during the test.
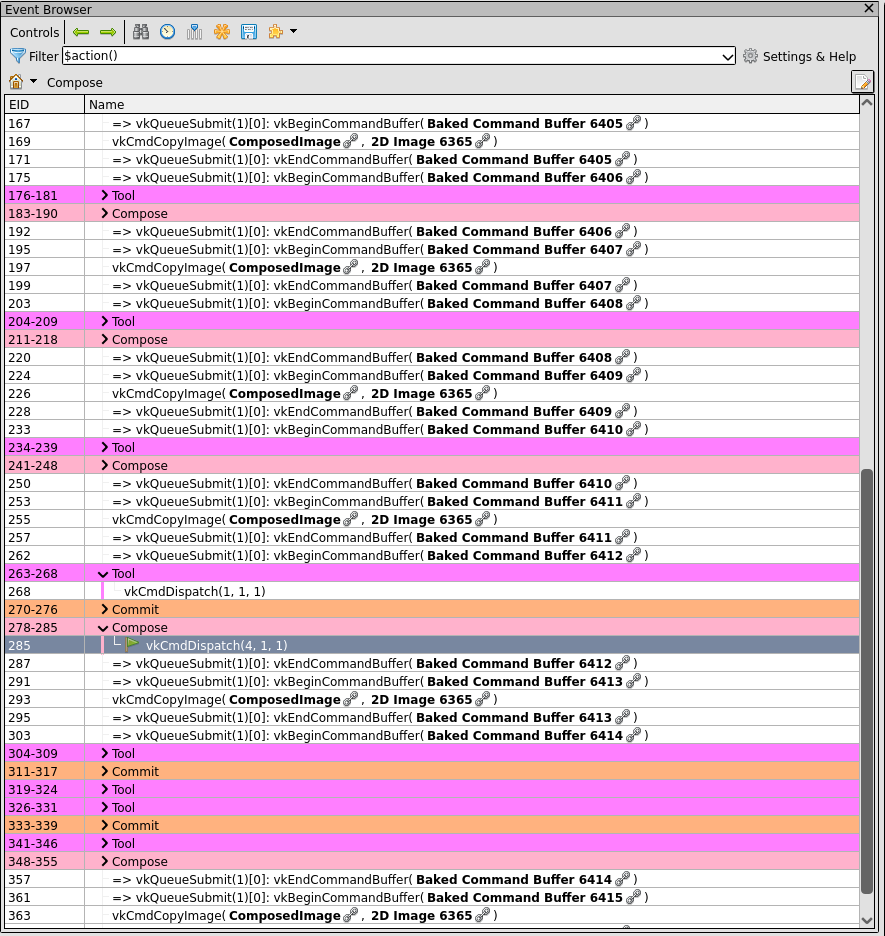
In Vulkan we can also insert custom debug markers with text into command buffers using vkCmdBeginDebugUtilsLabelEXT entrypoint. Analyzer tools such as RenderDoc will pick that up and display it in their event viewers. Here’s an event viewer in RenderDoc with command buffer API calls sorted by their purpose.
Conclusion
The testing setup created for Pint is robust and allows for easy test creation and debugging. It has an infrastructure to help with verifying results of complicated graphics processing, while also allowing for very simple unit tests of miscellaneous code. The tests are a core part of the development of Pint and almost no new feature is written without securing it with a meaningful test. In the next article we’ll talk about implementing our first non-trivial tool - the pencil.
Yes, I made up the number. ↩︎
I know, this is a luxury not a common thing coming with an API. ↩︎
I’ve done a thing or two in the driver development department. Trust me, it’s not a small feat. ↩︎
Yeah, that’s not really a good incentive for the reader to use it. “Oh, I like it, cause it’s the only thing I know”. Anyway, they’re not paying me to advertise it, so I don’t have to try. ↩︎
It’s a common technique in the GPU world. CPU-invisible memory usually yields better performance and is more abundant, so most of the allocations utilize it. CPU accesses (either uploads or readbacks) are rather rare, so it’s fine to require additional copy to perform them. ↩︎